Configuration
After you’ve installed the datasource and restarted Grafana you can configure the TSDS Datasource. Under Grafana’s gear menu, click Data Sources. The next page will list all currently configured Data Sources. Click the Add data source button. Select GlobalNOC TSDS from the list of datasources.
Give the data source a name like tsds. Under HTTP you’ll want to set URL to your TSDS’s service API endpoint. e.g. https://tsds.example/services/. Set Access to
Server (Default).
It’s likely that your services API will be protected with user
permissions. If protected by basic auth, select Basic Auth, With Credentials, and then input the user credentials you wish to use. Clicking on Save and Test should show Data source is working success message. Other authentication methods are not covered in this guide.
Your First Query
To get familiar with the visual query builder let’s walk though a simple example. Assuming you’ve already created a new dashboard create a new panel of type Graph. Click edit.
To craft our TSDS query, we first tell Grafana we want to use the TSDS
datasource. Select the Queries tab if you haven’t already. Then change
the Panel Data Source from default to tsds. You should now see the
visual query builder.
From
In the From row, click the dropdown and select interface. This
is the measurement type that we will be querying from TSDS. The
measurement type defines which metrics are available for graphing in
the Get row.
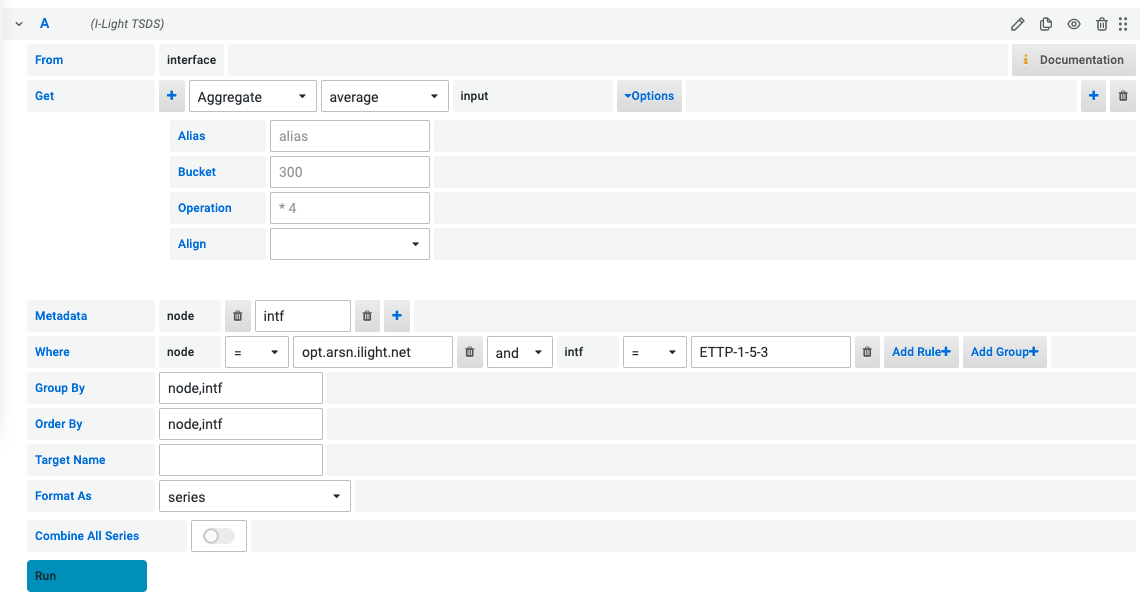
Get
In the Get row, leave everything as it is. The default setting,
average input over time is a good first example. This states we wish
to graph the input metric aggregated every Bucket seconds (when left
empty Bucket will be auto-selected).
Metadata
In the Metadata row, click the dropdown and select node. Click
the + button and select intf. This defines how the results of the
query are identified. In our case, each series returned will be
identified by its associated node and interface
name. E.g. opt.arsn.ilight.net ETTP-1-10-1-4P1
Group By
In the Group By row, insert node, intf. This ensures that every
series is averaged over unique node, interface pairs. If we only
specified node, the series would graph the average input over all
interfaces on a node.
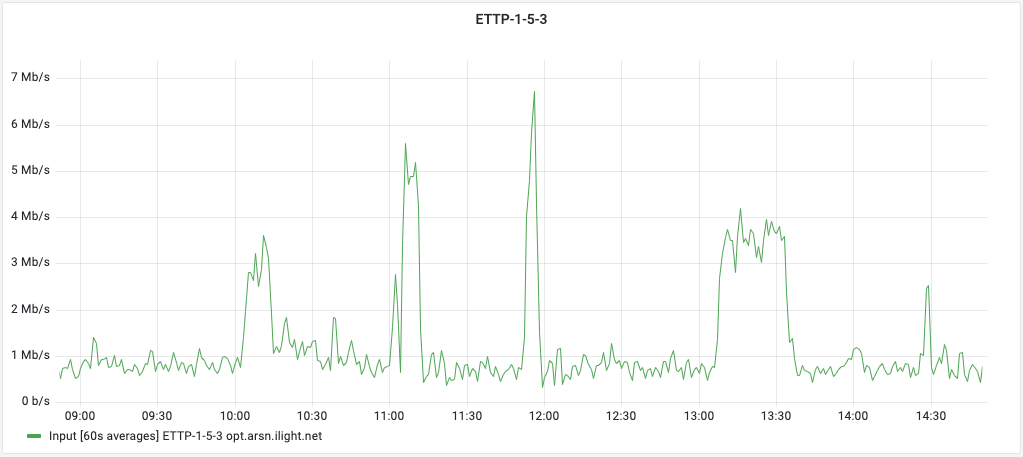
Where
In the Where row, select node from the dropdown. Select = from
the operator dropdown. Finally type a character into the input box;
This should expose some devices via auto-complete. Once a device has
been selected, your graph will be populated.
subscribe via RSS